Monitor CDC and Migration Streams in Real Time

  • Real-time monitoring
  • SQL query audit
  • Persistent run history
  • Per-table throughput

Built into DBConvert Streams. No external monitoring stack to deploy.

Observability for data streams means knowing what each stream is doing right now, what it did before, and exactly which queries it ran against the source and target. Without it, a stuck migration or a slow CDC run becomes guesswork — checked by tailing logs, hitting databases manually, and reconstructing what happened from memory.

DBConvert Streams ships with built-in observability for every stream: the live monitor shows reader and writer activity, table progress, and current throughput; the SQL audit lists every query the engine ran with timing and context; and persistent run history keeps a record of each execution per configuration so failures can be compared and explained later.

LIVE MONITORING

Real-Time Stream Monitoring

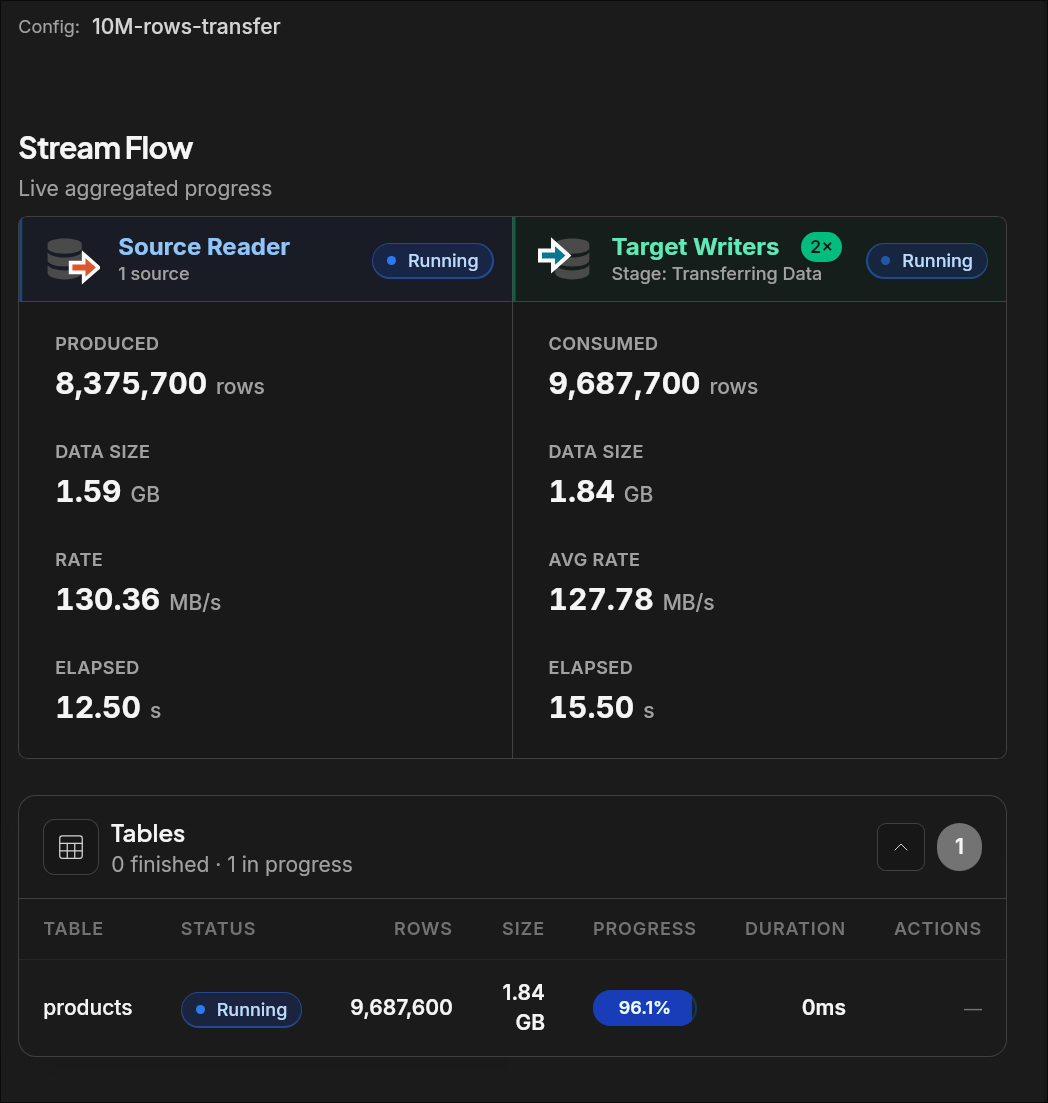
Follow reader and writer activity as it happens, including stage, throughput, and table progress.

Live stream monitor showing source reader, target writers, throughput, and table progress

Live monitor view with stage, rate, and table-level progress in one panel.

Pipeline Lifecycle

Initialization
Metadata Replication
Data Transfer
Target Delivery
Finished

Target Delivery becomes S3 upload only when object storage is the selected target.

Status Lifecycle

READYRUNNINGPAUSEDFINISHEDFAILEDSTOPPED

Source Reader

  • Produced row/events counters
  • Transferred data size
  • Current rate and elapsed time
  • CDC bootstrap and checkpoint visibility for initial-snapshot runs

Target Writers

  • Consumed row/events counters
  • Written data size
  • Average rate and active writers
SQL AUDIT

SQL Query Transparency

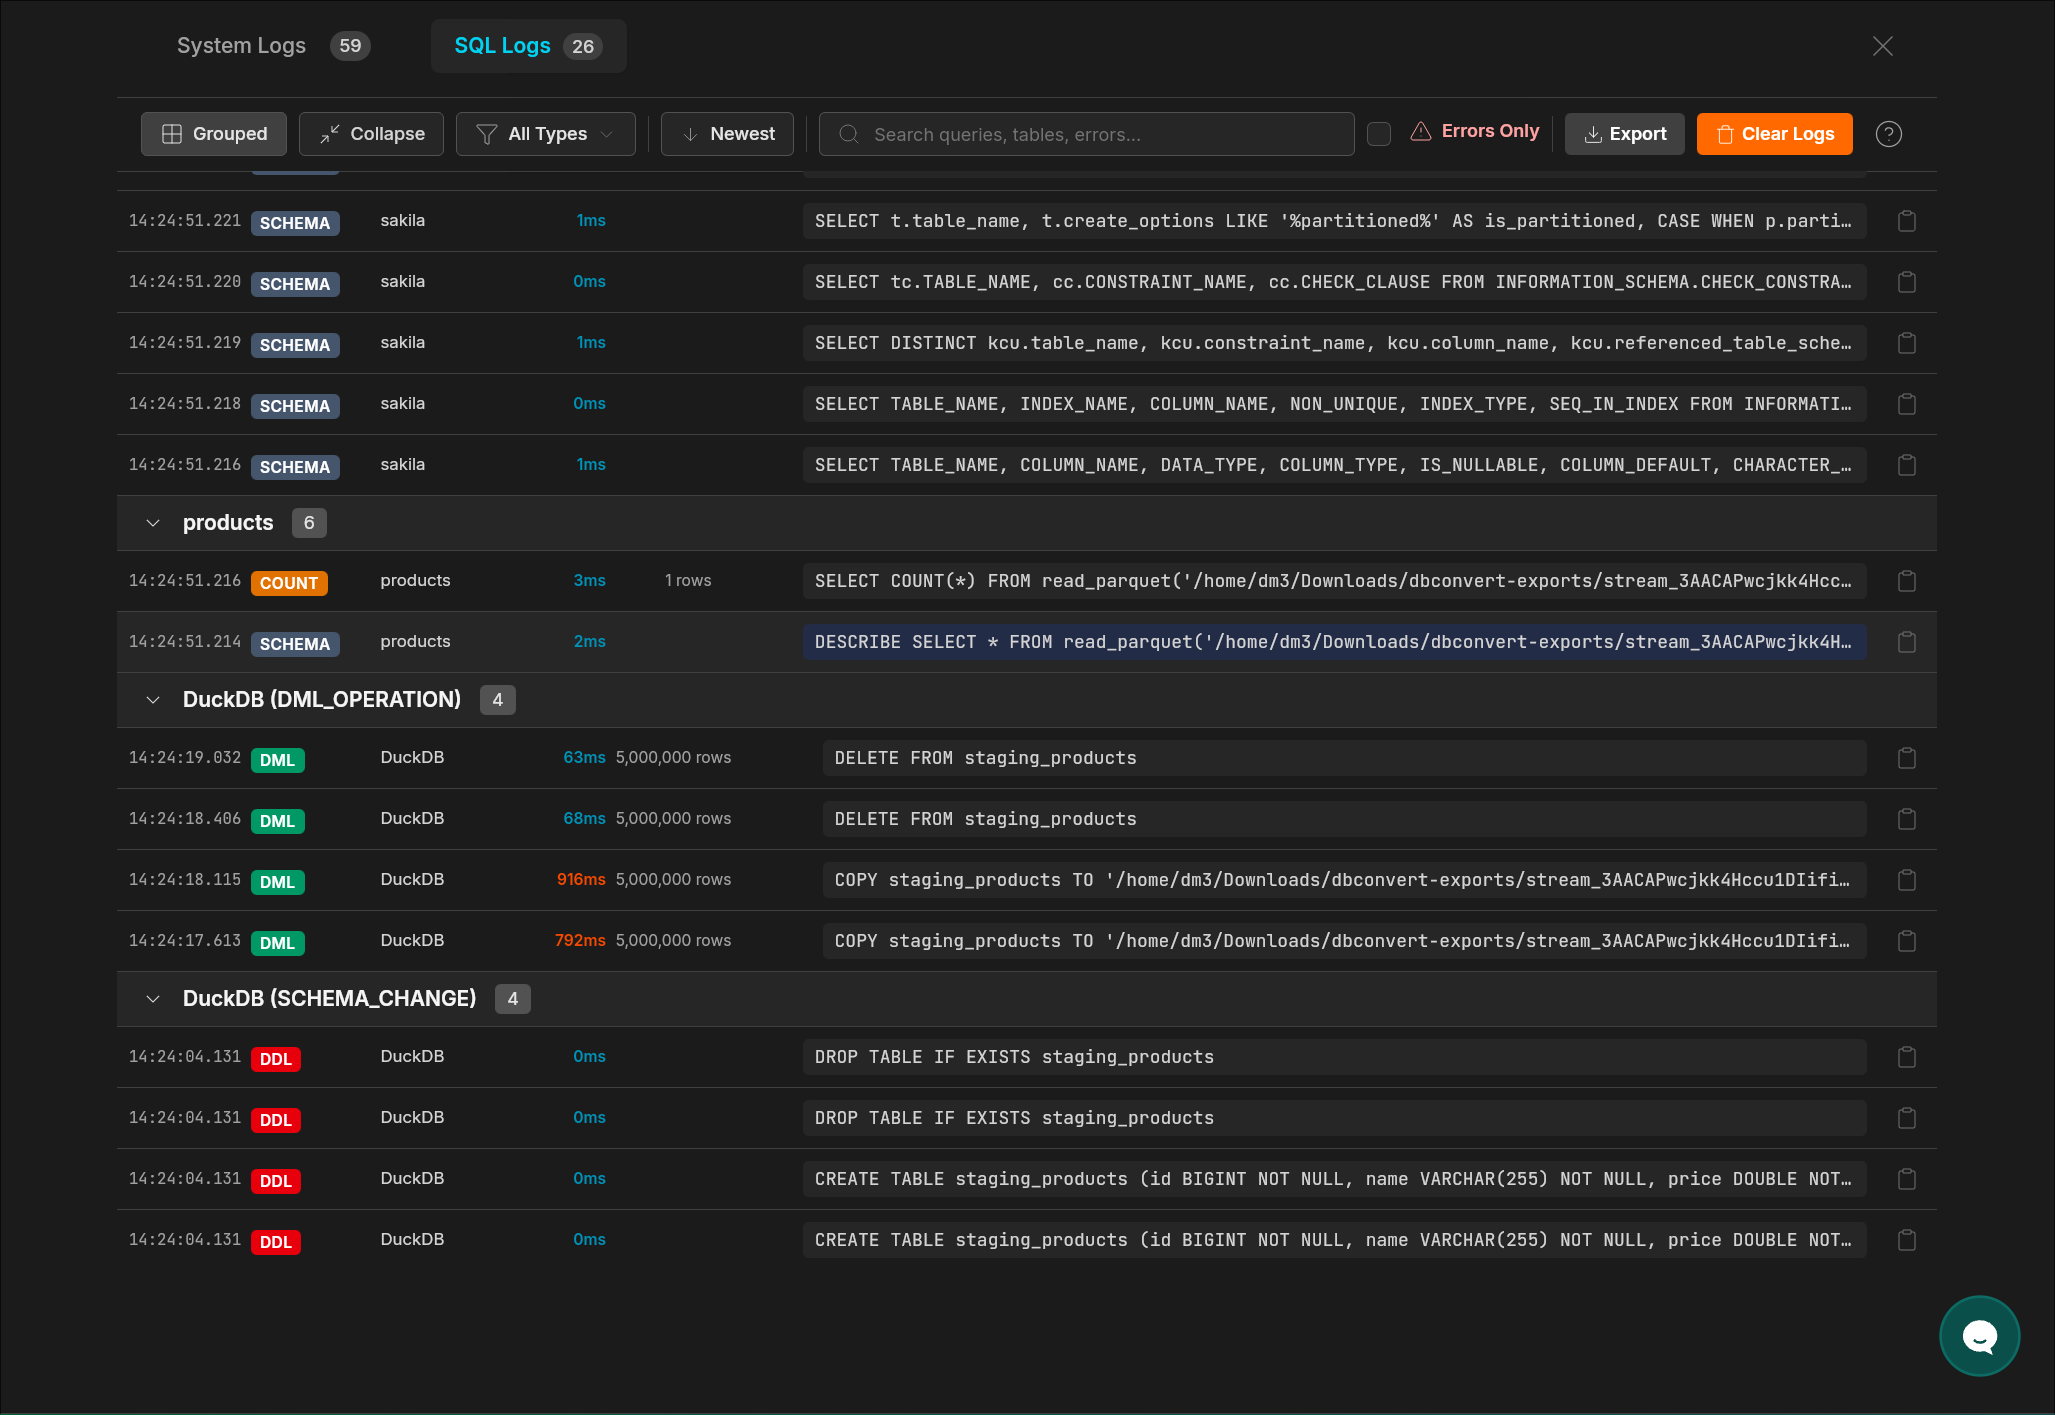
Track executed SQL with timing and context across streaming and schema exploration workflows.

SQL logs panel showing grouped queries, filters, durations, and expanded SQL text

SQL logs with grouped view, filtering, and expanded query details.

Every Query Tracked

  • Query purpose and execution duration
  • Row count affected or returned
  • Database, schema, and table context
  • Error state and message capture

Query Classification

Schema IntrospectionData QuerySchema ChangeDML OperationConsole Query
LOGS & HISTORY

Structured Logs and Persistent Run History

Diagnose incidents faster with searchable logs and historical run records per configuration.

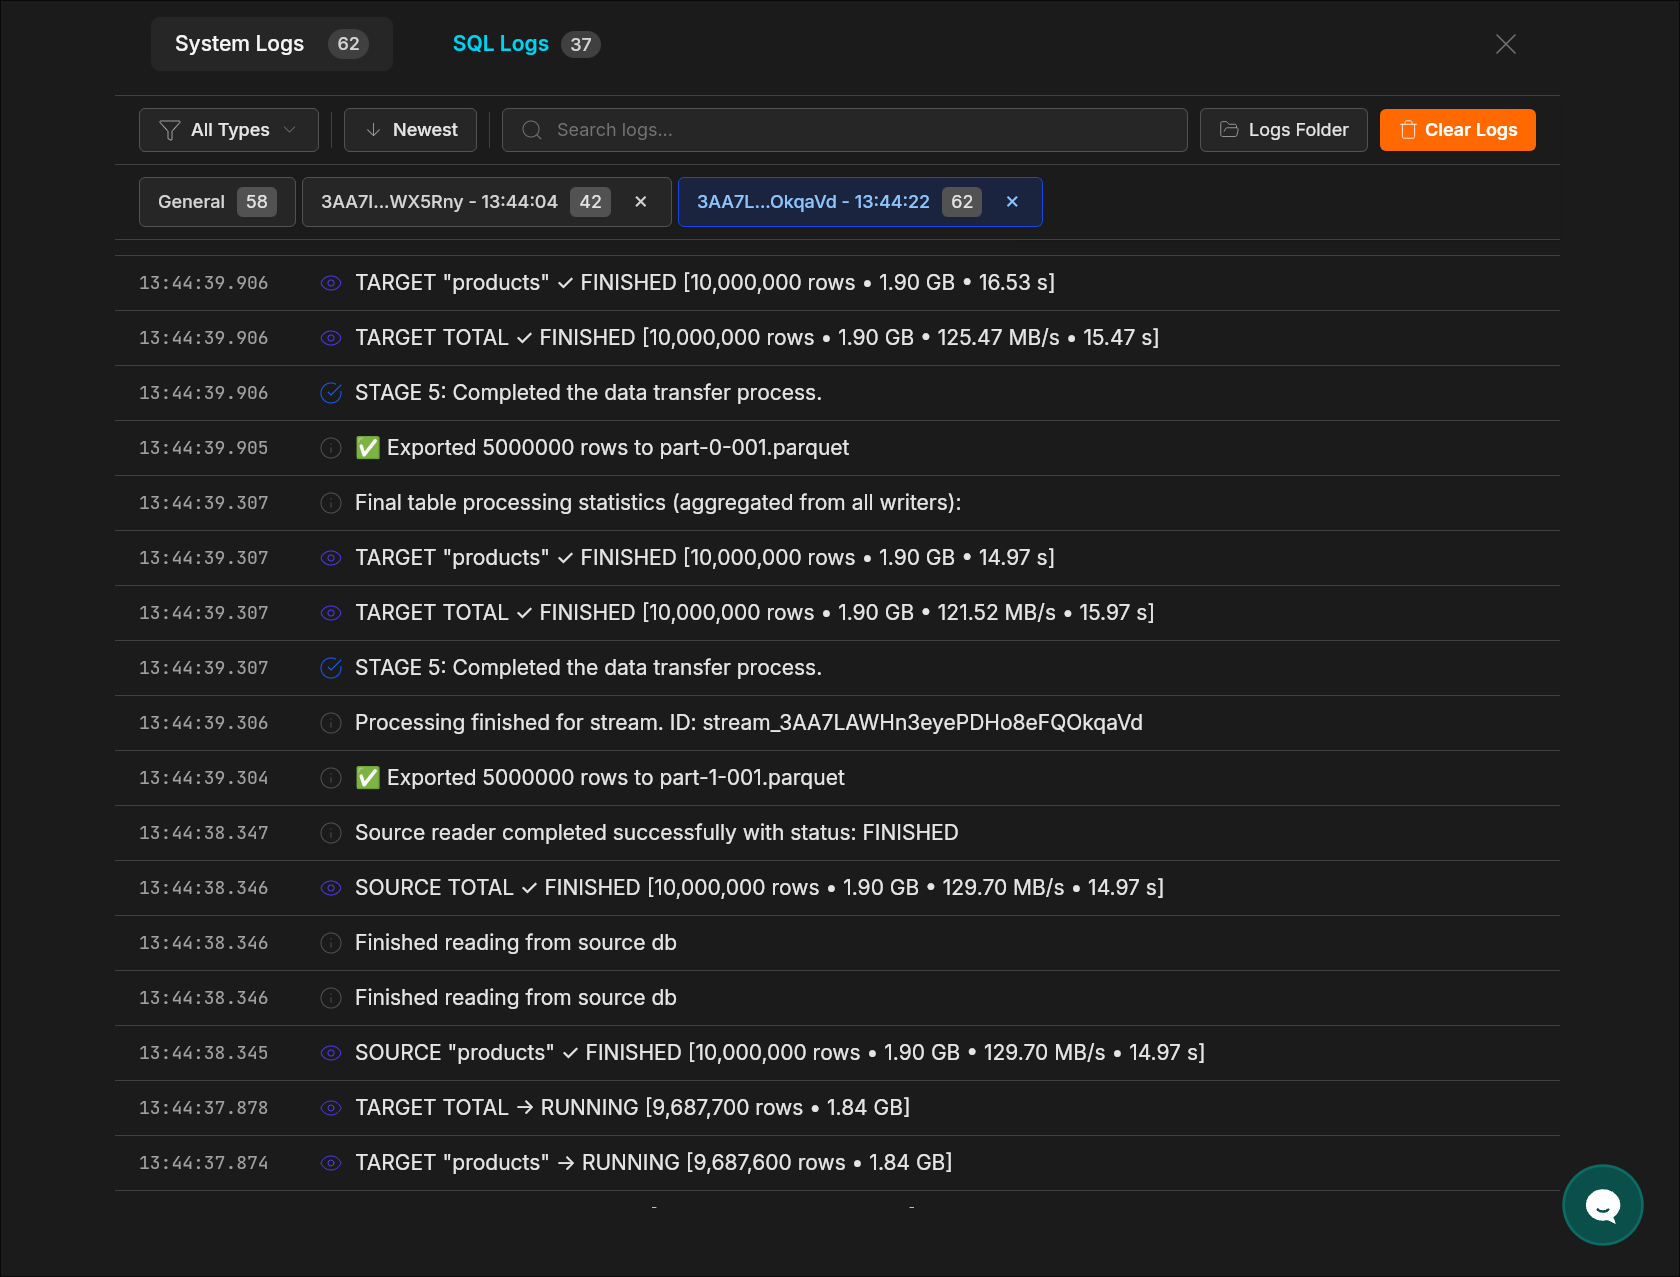
System and SQL Logs

  • Filterable system and SQL log streams
  • Search and grouped log navigation
  • Export logs as JSON, CSV, or text

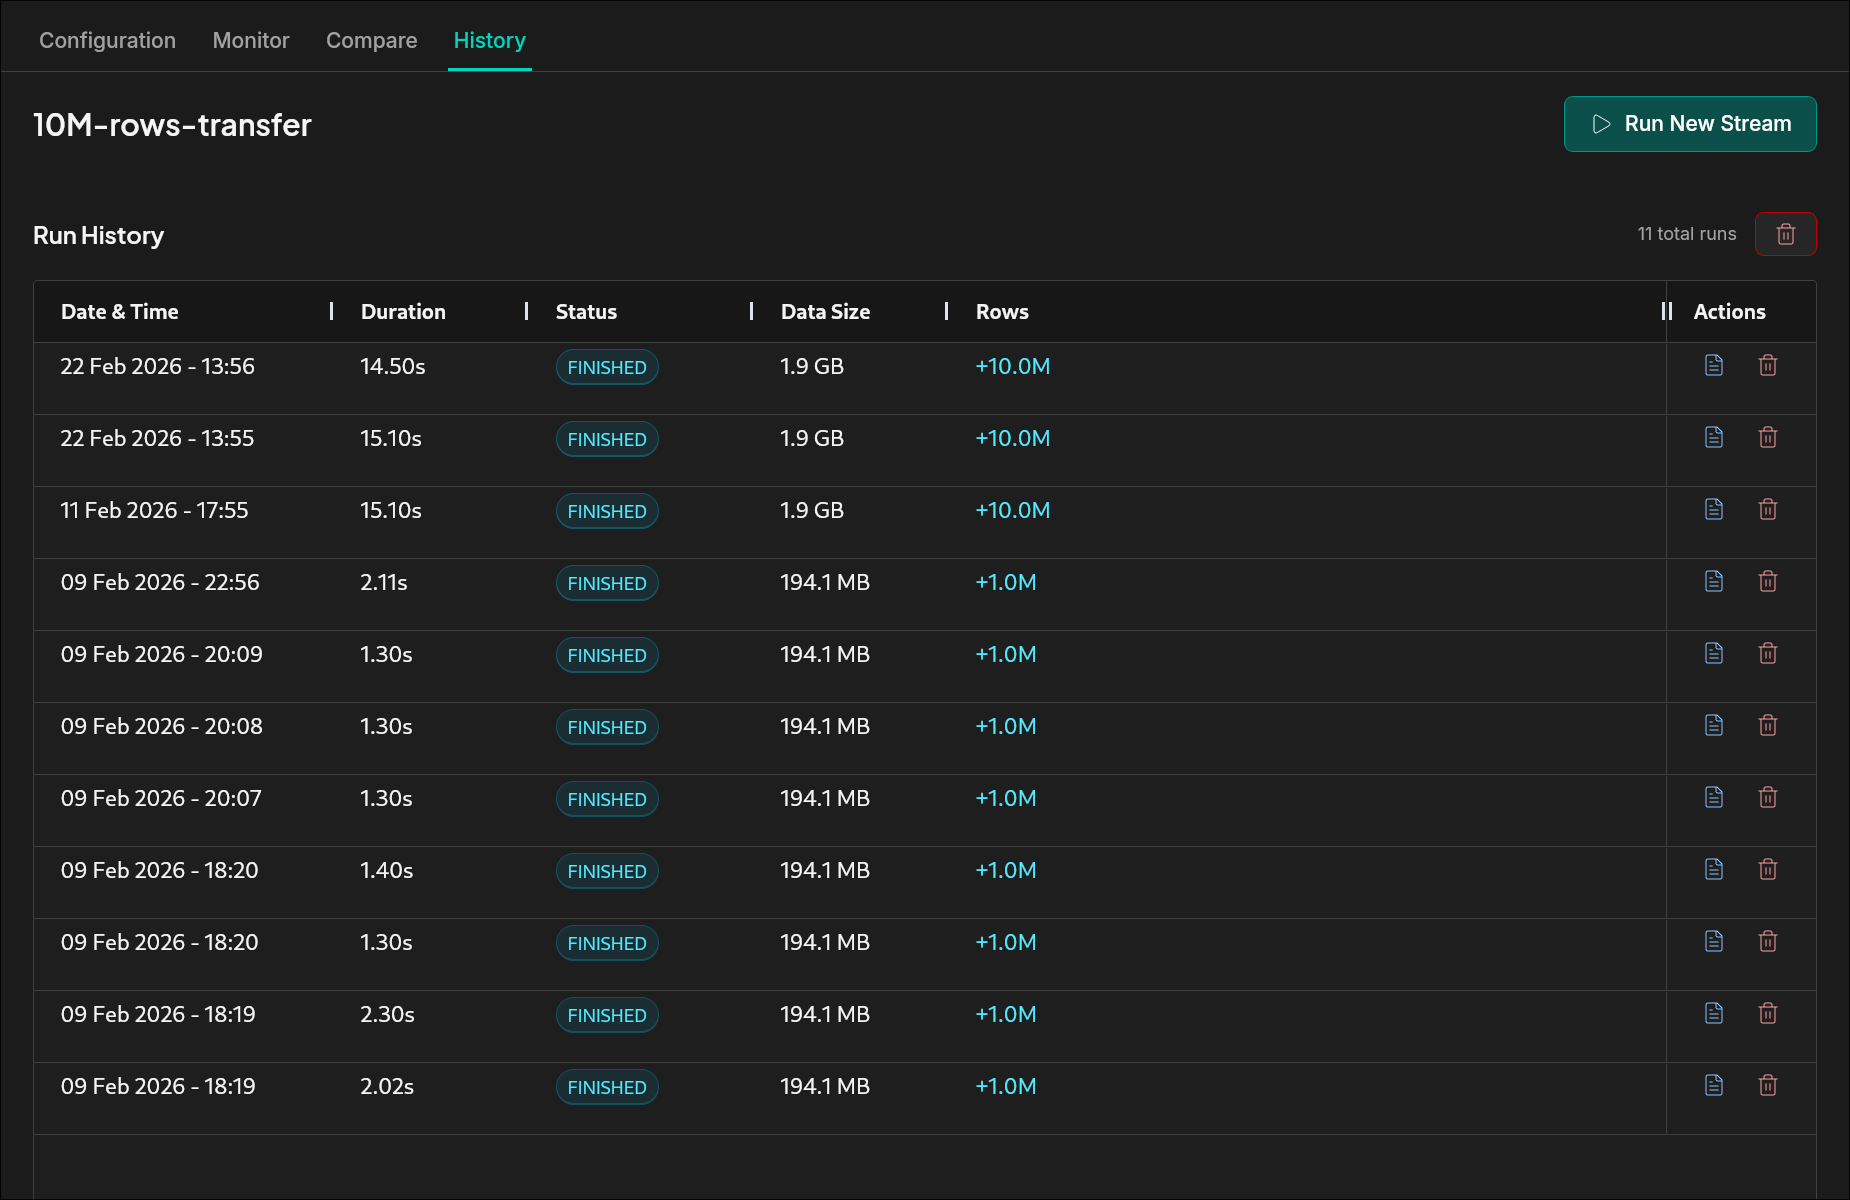
Run History

  • Run ID, status, and duration per execution
  • Rows processed and data-size totals
  • Historical comparison across repeated runs
System logs view with stream stage events, transfer stats, and export entries

System log timeline with stage and transfer events.

Run history table showing execution time, duration, status, rows, and data size

Persistent run history for audit and comparison.

Log export support: JSON, CSV, and plain text from UI or API.

Performance

Throughput and Target Visibility

Measure current and cumulative rate, then isolate slow tables or target-side bottlenecks.

Interval Rate

Short-term throughput in the current window

Live Rate

Current transfer speed at this moment

Average Rate

Cumulative throughput from start to now

Table-Level Statistics

  • Rows and bytes transferred per table
  • Per-table progress and elapsed duration
  • Fast isolation of slow or failed tables
  • Chunk-level snapshot-copy planning via stats API when resumable copy is active

Target Delivery Visibility

  • Target-side completion and write status tracking
  • Object-storage upload metrics when S3/object target is selected
  • No upload stage is shown for database targets
FAQ

Technical questions

Does monitoring add overhead to the stream?

Counters and stage updates are part of the stream lifecycle and run inline — they do not require a separate agent or external metrics backend. SQL audit and log capture run at the engine level, so there is nothing to install on the source or target.

Are stream metrics exposed via API?

Yes. Stream state, throughput, run history, and logs are accessible through the DBConvert Streams REST API in addition to the built-in UI, so they can be queried by external tools or scripts.

What happens when a stream fails?

The stream enters an explicit FAILED state, the failure point is preserved in run history, the SQL audit shows which query caused or surrounded the failure, and the stream resumes from its last committed checkpoint when restarted — not from the beginning.

Ready to Stream with Full Visibility?

Monitor, audit, and diagnose every stream run from a single interface.

Your AI assistant can read the same status, errors, and logs — AI assistants via MCP.