Where does the diagram come from?
The diagram is generated directly from the connected database's metadata (information_schema and equivalents). There is no manual modeling step and no exported SQL file to keep in sync.
Runs inside Data Explorer, no external plugin.
An ER diagram shows tables, columns, and the foreign-key relationships between them, so the structure of a schema can be read at a glance instead of inferred from DDL or data. ER diagrams are most useful when you need to understand a database you did not design — before a migration, during onboarding, or while reviewing dependencies for a feature change.
The ER diagram tool in DBConvert Streams reads a live MySQL or PostgreSQL connection and renders the schema directly. Tables, primary keys, foreign keys, indexes, and view dependencies are detected automatically, junction tables are identified by their structure, and the layout uses a force-directed graph so the diagram stays readable as the schema grows.
No manual modeling. Open a connection and generate a diagram instantly.
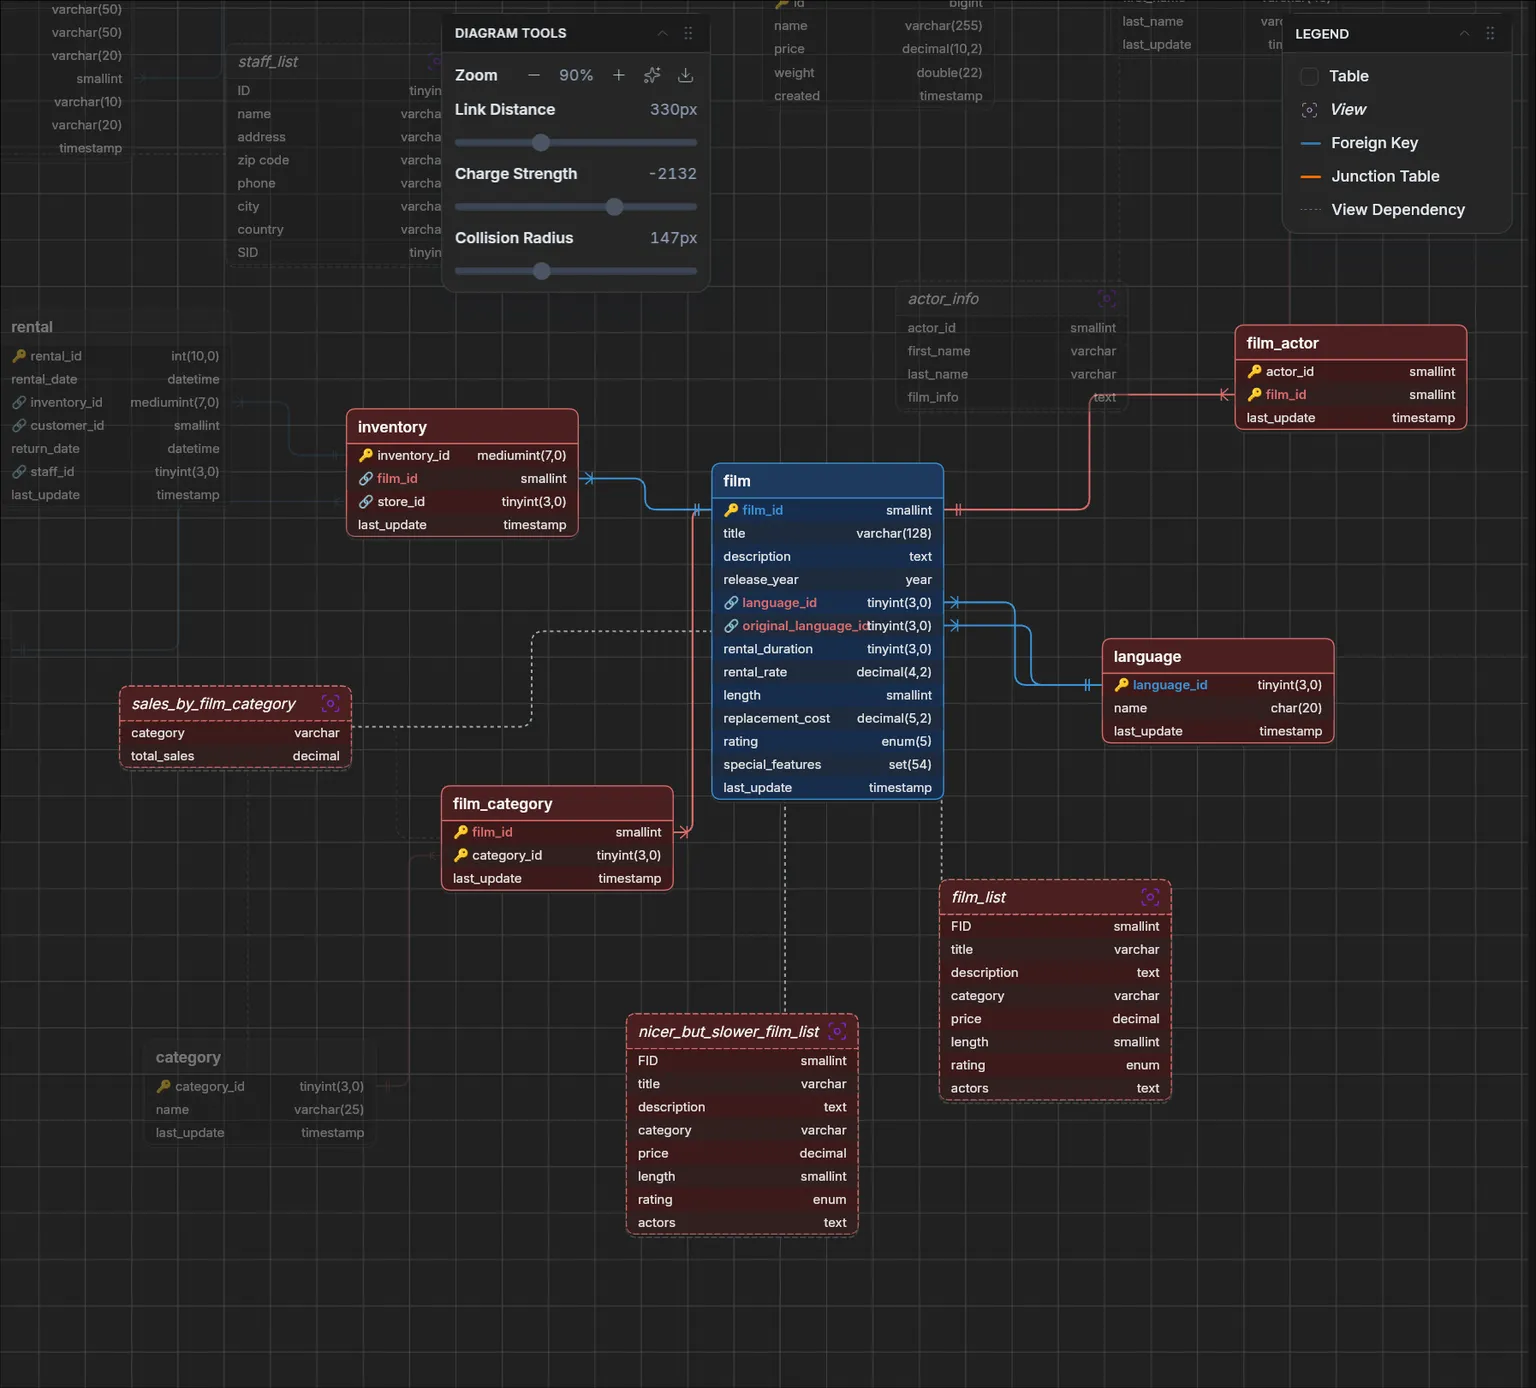
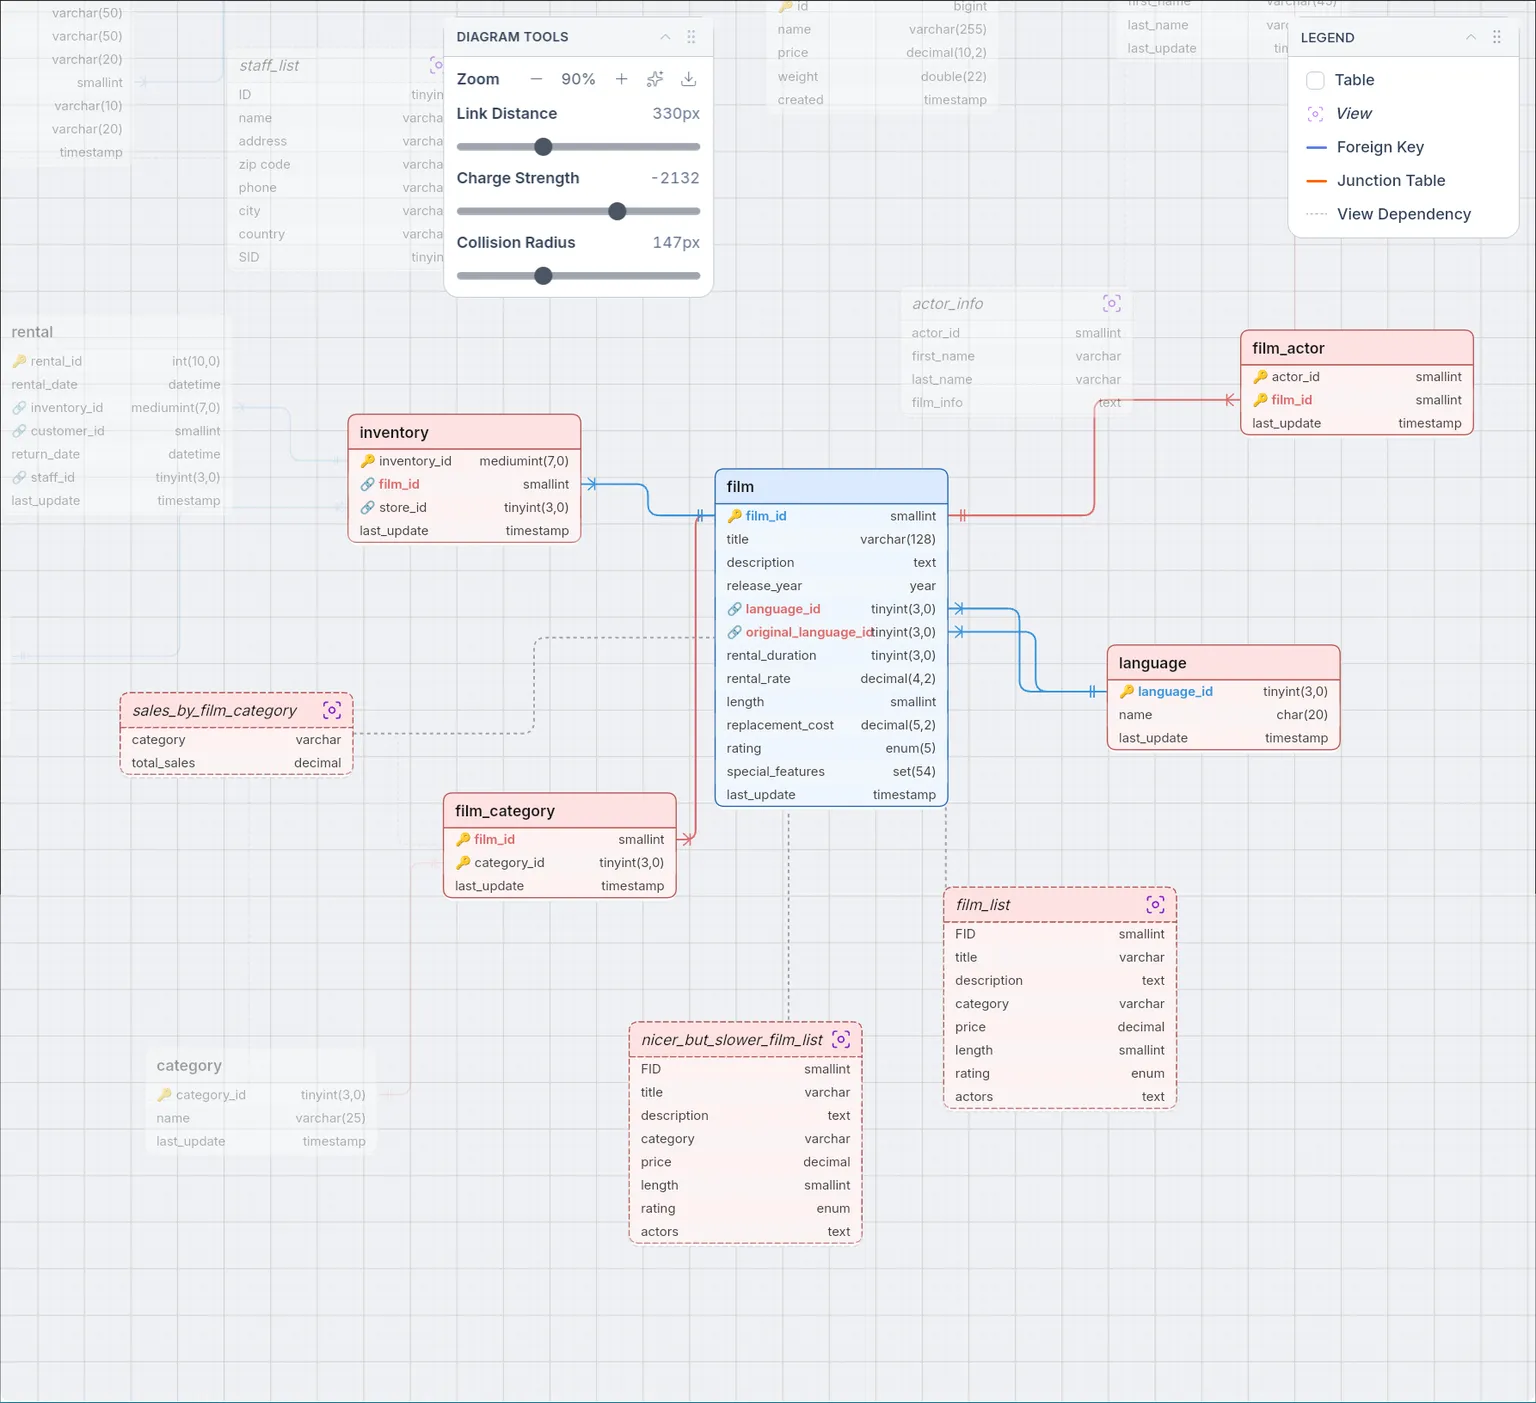
Interactive ER diagram with crow's foot notation — auto-generated from a live database schema.
Designed for real exploration, not static exports. Navigate complex schemas visually and follow relationships instantly.
Complex schemas remain readable. A D3-powered force-directed graph engine arranges tables automatically, and you can tune the layout to fit your schema.
Controls spacing between connected tables. Increase to spread tables apart.
Controls repulsion between tables. More negative values push tables further apart.
Minimum distance between tables to prevent overlap.
Zoom in and out with controls, mouse wheel, or reset to fit all tables.
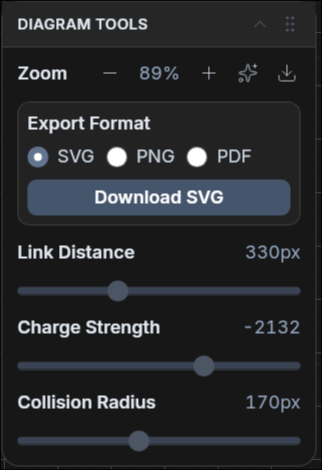
Adjust link distance, charge strength, and collision radius to optimize layout for dense schemas.
Relationships are displayed using industry-standard crow's foot notation, so diagrams are immediately readable by any database professional.
The most common relationship. One record in the parent table relates to multiple records in the child table.
Example: One customer has many orders.
Two tables related through a junction table. Automatically detected when a table has exactly two foreign keys forming a composite primary key.
Example: Films and actors via film_actor table.
Dashed lines show which tables a view depends on, making it easy to trace data lineage.
Example: A summary view referencing multiple base tables.
Junction table detection. Tables with exactly two foreign keys that form a composite primary key are automatically identified as junction tables and rendered with many-to-many relationship lines.
The diagram is generated directly from the connected database's metadata (information_schema and equivalents). There is no manual modeling step and no exported SQL file to keep in sync.
The diagram represents the live schema, so the data model itself is read-only. The layout is interactive — drag tables, pan, zoom, tune force parameters, and isolate related tables — but you cannot create or drop tables from the diagram.
The diagram reflects the schema at the moment it was generated. Reopen the diagram against the same connection to pick up new tables, columns, or relationships.
Yes. Diagrams can be exported as SVG, PNG, or PDF for documentation, design reviews, or sharing with people who do not have access to the source database.
Connect your database and visualize its schema in seconds.
Read the ER Diagrams documentation